
“Best trading software for retirees”
One very interesting research tool I bought years ago is the TradeMiner PRO. You can buy it for stocks, commodities and FOREX. I mostly use it for stocks. What they do is look at historical EOD prices and calculate “If you have traded XYZ on this day during the past 10 years you would have been profitable XX % of the time if you held the stock for X days.” I have done some back-testing and live trading and it works pretty well.
As with ALL TOOLS I still believe in the “art of trading”. However, if you spend the time using one or several tools – add all the info together and make the trading decision.
You need to understand that TradeMiner PRO is NOT a trading system. It is a research tool. And a clever one at that.
What is TradeMiner PRO?
TradeMiner Pro is a powerful software tool designed to help traders identify historical seasonal trends and market cycles across stocks, futures, and forex markets.
By analyzing extensive historical data, it enables users to uncover patterns that have consistently occurred in the past, providing valuable insights for making informed trading decisions.
“Being in the analytical business myself, and because I use it as a tool, I almost hate to see it go out to everybody. It’s like having your own personal research staff sitting right on your desk in a little box.” –Scott Barrie Former Floor Trader*
Problems TradeMiner Solves for Retired Traders
- As a retiree, you want to reduce risk while trading. TradeMiner helps you find historically strong trading opportunities, so you can make data-driven decisions rather than guessing.
- You don’t want to spend hours analyzing charts and market trends. TradeMiner simplifies research by scanning decades of historical data and highlighting profitable seasonal trends for you.
- As a retired trader, you need predictable and reliable patterns. TradeMiner identifies repeating market cycles, so you can focus on trades that have historically performed well.
- You want to maximize your retirement income without unnecessary stress. TradeMiner helps you trade smarter by uncovering opportunities with a strong historical track record, giving you more confidence in your decisions.
Case Study
Here is how I used it on a list of ETFs to pick a short list of possible high-probability trades I researched and decided on:
Parameters:
- Month of March – at least 10 year analysis
- Having won >80% of the time
- 1-5 Trading days (Short is better for ETFs)
- Risk/Reward Ratio >1:2 is desired
- Score in the green > 3.00
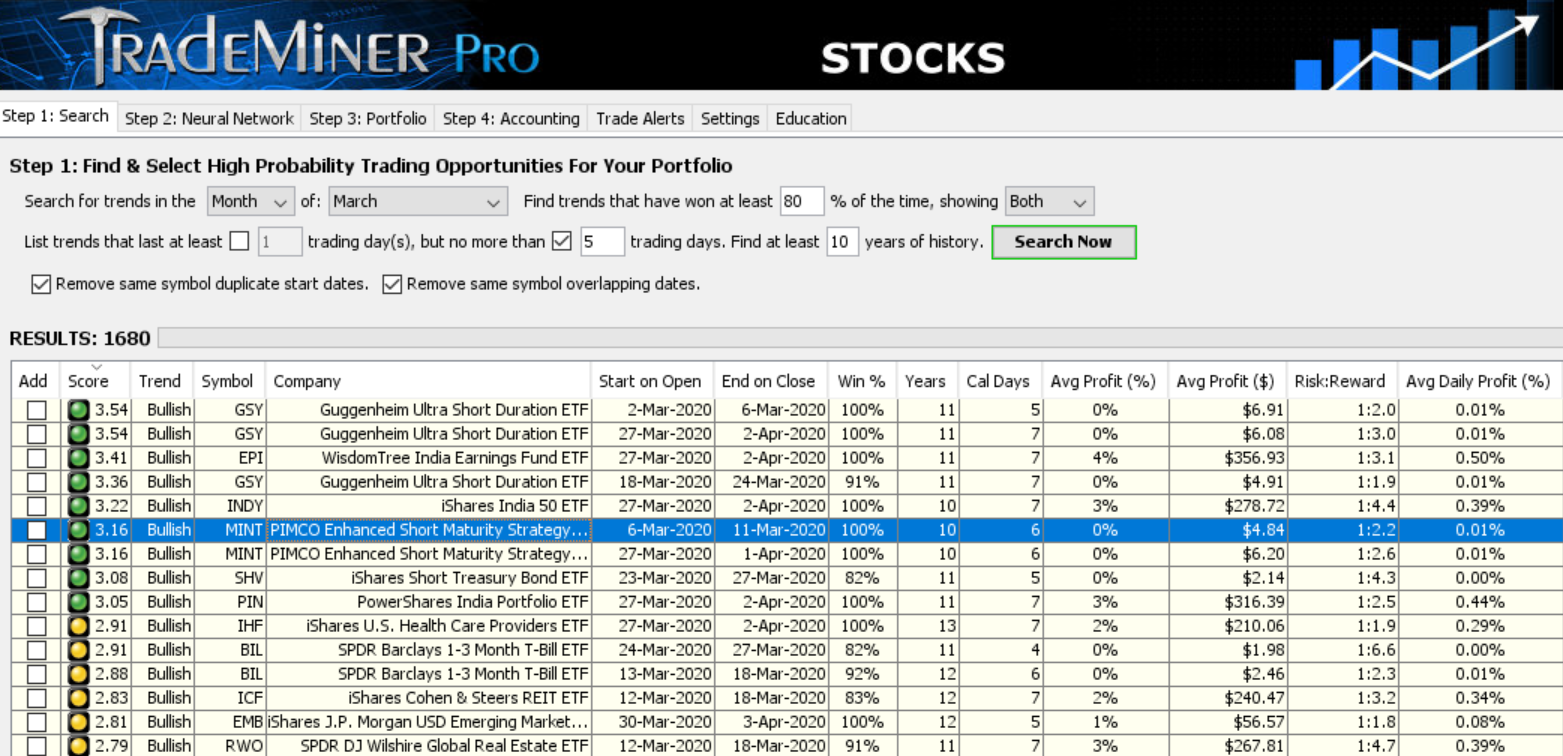
I often changed the parameters to get the best opportunities. By recording the different settings in a spreadsheet I can run through several different scenarios – for example 85% wins and max 20 trading days. I copy the top ones (>3.0 score) and paste into a spreadsheet. Then I sort the spreadsheet to list the top of the different tests.
“TradeMiner is the best tool I’ve found for helping me identify momentum moving Stocks, Futures and Forex opportunities. Using this tool in combination with my technical indicators has given me a true 1-2-3 knock-out-punch; just as Lan teaches. It saved me untold countless hours from trying to calculate these things manually. I’m proud to put my name behind TradeMiner” –Dr. Scott BrownFinance PhD.*
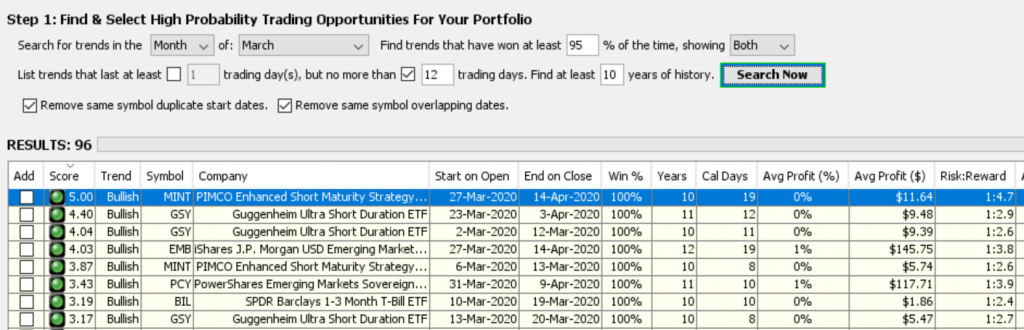
In this case I created several different scenarios – and by picking the top results you can see that 95% and 12 trading days is the optimal for these ETFs. Now I pick the top one and schedule it for a trade on March 27 – April 14. Notice the RR is 1:4.7. So if you trade a scenario like this over and over you should have 4 wins vs 1 loss. This is if you stick to the schedule and NOT take profits if you see profits. You wait until 14 April and close the trade. Whatever the result is at that time. Sure, in day 5 you might have a profit and it is tempting to close the trade and take the profit. And move on to the next one.
The final step I want to do is pick the top ETF (MINT) and run the same scenario for that symbol only for the year.
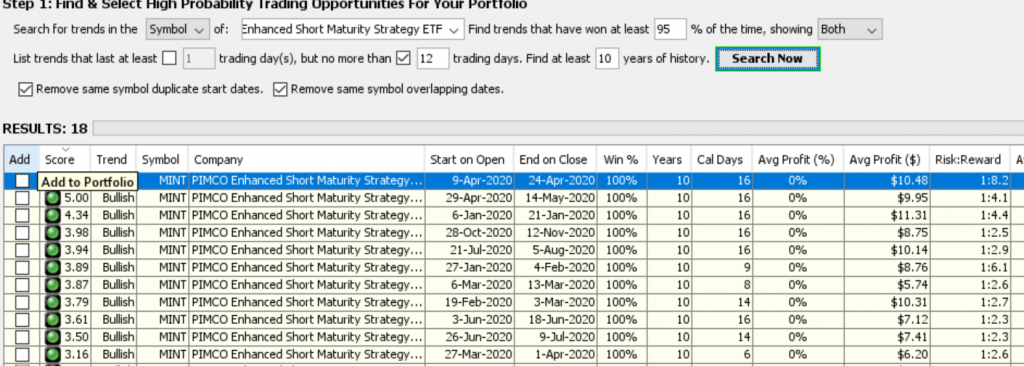
Now I have a tradeplan for this symbol. And can back-test for previous dates. There is another great feature in TradeMiner called Neural Network. You pick the top results and run it there. It will tell you the past results and project the future. In this case it shows MINT was profitable 3/4 times this year. I would take those results all day.
As in ALL analysis and strategies – they WILL FAIL once in a while. You cannot rely on any one analysis or strategy. This tool is absolutely my favourite, but I use it in conjunction with several other tools and make a decision based on all those put together.
The subscription fee is $199 a year for all three feeds (STOCKS, COMMODITIES and FOREX). Once the fee is paid, historical data for the feeds become available for the subscriber. This software enables you to scan the past 30 years of the market to find the most profitable trends and assets according to their minimum and maximum quotations. This information can assist you in making an informed trading decision.
The software offers a user-friendly interface that allows traders to scan market data seamlessly. Users can search for trends by month or specific symbols, define minimum historical accuracy, set desired trade durations, and specify the number of years to look back. TradeMiner Pro then ranks the historical results using a proprietary scoring system, highlighting opportunities with the greatest historical gains achieved in the shortest time with the least risk. Additionally, the platform provides various charts and graphs, such as historical equity graphs and year-by-year comparisons, enabling traders to visualize past performance and assess potential risk versus reward.