I believe in simplicity. Over the years I have set up charts with dozens of indicators and lines and tried to make sense of all of them. Impossible. These days I use very clean charts. On the very basic level, and these few strategies are the simplest form of chart reading and when used can produce high probability trades. I should note that for this to work well, the market has to be reasonable stable. This is why you need to do some background research to see if there are any events happening that could suddenly cause a drastic change. Elections. Earnings reports. All sort of world events can move the market. Having said that, these two strategies has worked really well for me and form the basis of my trading decisions.
I am interested in a couple of things:
- Support and resistance levels
- The overall price fluctuations – is it within a channel?
- Obvious price trend – up or down?
- Where the price is compared to R&S and the channel
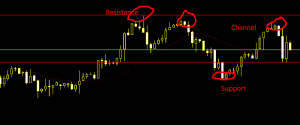
On this 4HR chart sample I make the following conclusions:
The channel is reasonable well defined. The price is in the middle of the channel. I wouldn’t trade now. I would look for the price to be close to the top or bottom of the channel.
Although the overall trend into this channel is up, I notice the resistance points are dropping. If the price climbs closer to the top channel AND the resistance is lower than the other two peaks – I would say the chances are good for the price to deteriorate. I would trade this short when the price climbs to the last resistance point. I would set my stop to the top channel price and my limit to close the trade to near the bottom channel.
NOTE about stops and limits: If you set your limit (take profit point) to at least 2x stop value – you only have to be right 50% of the time to break even. Set it to 3x and if you are right 50% of the time you are well into the money.
Channels are great. You can trade channels all day long and come out ok. Keeping stops close to the channel lines will protect you for the day the price will break out of the channel. Because it will do that. And if you follow the price, you can get indicators to help you determine if the price will break out at the top or bottom.
Then next top strategy that is easy to recognize and trade is the retraction from a rising price. Basically if the overall trend is steady up then the price will retract and continue to climb. Instead of blindly buying into a long trend – wait for retractions.
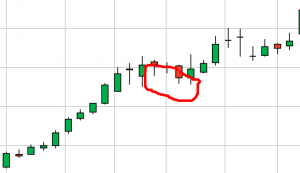
Here the price was on a good climb. Sure, tempting to join the trip and that would have worked out well.. but when the retraction happens and it confirm the continuance of the trend then it is a safe bet. You would put your stop below the last retraction and your limit above the last highest point.